
Introduction
MRI in Head and Neck Cancers
Head & neck cancer is a leading cause of cancer worldwide. For the past 20 years, our group has been researching the role of MRI in cancer detection, prognostication, treatment planning and follow-up. We are a pioneering centre in functional MRI for head & neck cancer and are at the forefront of developing and evaluating DWI, MRS, DCE-MRI and CEST for tumour detection, characterisation and prediction as well as monitoring treatment response.
MRI of Nasopharyngeal Carcinoma
We have a special interest in nasopharyngeal carcinoma (NPC). Our group was among the first to document the MRI patterns of primary and nodal spread of this cancer, to compare MRI and FDG-PET, and to report a range of treatment-induced complications. In our current research, we include MRI for early NPC detection. Using our MRI grading system, we have shown that MRI detects the 10% of cancers that are endoscopically occult. We have also used MRI to detect early stage NPC in collaborative plasma EBV-DNA population screening studies performed by the world-renowned Department of Chemical Pathology at CUHK and international organisations.
Head and Neck Ultrasound
Our specialist H&N ultrasound service and research was started in the early ‘90s, and our team remains responsible today for all neck ultrasound and guided biopsies in the neck. In addition to greyscale & Doppler ultrasound, our research in H&N ultrasound extends to computational analysis of intra-nodal Doppler vascularity, using algorithms to differentiate benign from malignant disease; sonoelastography of thyroid, salivary gland masses, lymph nodes and neck masses to evaluate their nature; and the swallowing mechanism following treatment for Head & Neck cancer, using ultrasound & video fluoroscopy. This pioneering work has resulted in multiple research articles, competitive grants, and invitations to deliver lectures and hands-on workshops at major international meetings
On-going Research
Distinguishing early-stage nasopharyngeal carcinoma from benign hyperplasia using intravoxel incoherent motion diffusion weighted MRI
Objectives: MRI can detect early-stage nasopharyngeal carcinoma (NPC), but the detection is more challenging in the plasma Epstein-Barr virus (EBV) DNA screening setting because early-stage NPCs must be distinguished from benign hyperplasia in the nasopharynx. This study aimed to determine whether diffusion-weighted imaging (DWI) MRI could distinguish between these two entities.
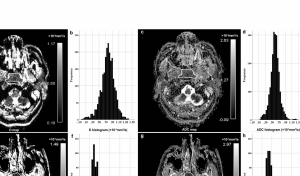
Pure diffusion (D) and apparent diffusion coefficient (ADC) maps and histograms of a representative subject with early-stage nasopharyngeal carcinoma (NPC) (a–d) and a representative subject with benign hyperplasia in the nasopharynx (e–h). The respective D mean and ADC mean values were 0.59×10⁻³mm2/s (b) and 0.82 ×10⁻³mm2/s (d) for the subject with early-stage NPC and 0.76 ×10⁻³mm2/s (f) and 0.93 ×10⁻³mm2/s (h) for the subject with benign hyperplasia.
Pre-treatment Amide proton transfer (APT) imaging predicts outcomes in undifferentiated nasopharyngeal carcinoma (NPC)
The objective of this study is to examine whether pre-treatment APT values of undifferentiated nasopharyngeal carcinoma primary tumour is able to predict the outcomes in two years follow-up time.
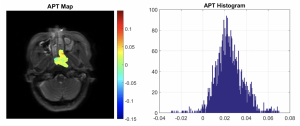
A 57 years old female with NPC (T3N2M0) showed no disease progression at 30 months follow-up from start of treatment (APT90= 3.89% ).

A 57 years old male with NPC (T4N1M0) had poor treatment outcome and PTR, LNR and DMs at 15.6 months follow-up from start of treatment (APT90= 7.49% ).
Amide proton transfer MRI detects early changes in nasopharyngeal carcinoma: providing a potential imaging marker for treatment response.
The objective of this study is to determine if treatment of nasopharyngeal carcinoma (NPC) induces early changes in amide proton transfer-weighted (APTw) magnetic resonance imaging (MRI), and to perform a preliminary evaluation of APTw imaging in response assessment.
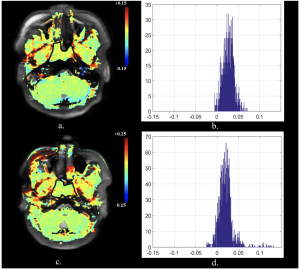
52 year old male with a histologically confirmed responding nasopharyngeal carcinoma. Pre-treatment (a) axial APTw image and (b) APT histogram. Intra-treatment (c) axial APTw image and d) APT histogram. The APTmean decreased from 2.67% pre-treatment to 2.05% intra-treatment (%Δ APTmean = -23.12%)
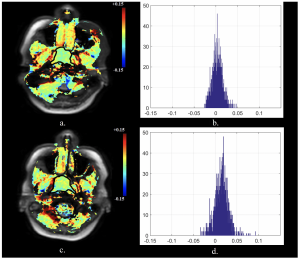
36 year old female with a histologically confirmed non-responding nasopharyngeal carcinoma. Pre-treatment (a) axial APTw image and (b) APT histogram. Intra-treatment (c) axial APTw image and d) APT histogram. APTmean increased from pre-treatment 0.26% to intra-treatment 1.45% (%Δ APTmean = +463.3%)
Past Research
Head and Neck Tumors: Amide Proton Transfer MRI
Law BKH, King AD, Ai QY, Poon DMC, Chen W, Bhatia KS, Ahuja AT, Ma BB, Yeung DKW, Mo FKF, Wang XY, Yuan J
OBJECTIVES: To evaluate the utility of amide proton transfer (APT) imaging in the characterization of head and neck tumors
METHODS: This retrospective study of APT imaging included 117 patients with 70 nasopharyngeal undifferentiated carcinomas (NUCs), 26 squamous cell carcinomas (SCCs), eight non-Hodgkin lymphomas (NHLs), and 13 benign salivary gland tumors (BSGTs). Normal tissues were examined in 25 patients. The APT means of malignant tumors, normal tissues, and benign tumors were calculated and compared with the Student t test and analysis of variance. The added value of the mean APT to the mean apparent diffusion coefficient (ADC) for differentiating malignant and benign tumors was evaluated by using receiver operating characteristic analysis and integrated discrimination index.
RESULTS: The mean APT of malignant tumors (2.40% ± 0.97 [standard deviation]) was significantly higher than that of brain tissue (1.13% ± 0.43), muscle tissue (0.23% ± 0.73), and benign tumors (1.32% ± 1.20) (P < .001). There were no differences between malignant groups (NUC, 2.37% ± 0.90; SCC, 2.41% ± 1.16; NHL, 2.65% ± 0.89; P = .45 to P = .86). The mean ADC of malignant tumors ([0.85 ± 0.17] × 10-3 mm2/sec) was significantly lower than that of benign tumors ([1.46 ± 0.47] × 10-3 mm2/sec) (P = .001). Adding APT to ADC increased the area under the curve from 0.87 to 0.96, with an integrated discrimination index of 7.6% (P = .13).
CONCLUSIONS: These preliminary data demonstrate differences in amide proton transfer (APT) mean of malignant tumors, normal tissues, and benign tumors, although APT mean could not be used to differentiate between malignant tumor groups. APT imaging has the potential to be of added value to apparent diffusion coefficient in differentiating malignant from benign tumors.
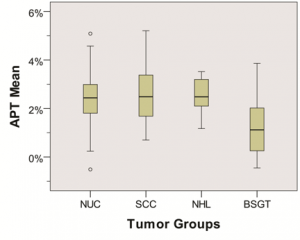
Figure 1. Side-by-side box plots of mean amide proton transfer (APT) in the tumor groups (nasopharyngeal undifferentiated carcinoma [NUC], squamous cell carcinoma [SCC], non-Hodgkin lymphoma [NHL], and benign salivary gland tumor [BSGT]).
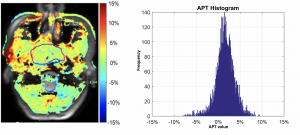
Findings in a 55-year-old man with nasopharyngeal undifferentiated carcinoma. (a) Amide proton transfer (APT) map overlaid on MR image with tumor boundary outlined. (b) Histogram of APT values (mean APT, 1.62%).

Findings in a 52-year-old man with squamous cell carcinoma of the tongue. (a) Amide proton transfer (APT) map overlaid on MR image with tumor boundary outlined. (b) Histogram of APT values (mean APT, 2.33%).
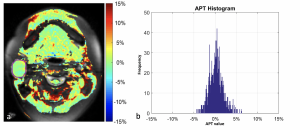
Findings in a 25-year-old woman with a parotid salivary gland tumor. (a) Amide proton transfer (APT) map overlaid on MR image with tumor boundary outlined. (b) Histogram of APT values (mean APT, 0.23%).
MR imaging criteria for the detection of nasopharyngeal carcinoma: discrimination of early-stage primary tumors from benign hyperplasia
King AD, Wong LYS, Law BKH, Bhatia KS, Woo JKS, Ai QY, Tan TY, Goh J, Chuah KL, Mo FKF, Chan KCA, Chan ATC, Vlantis AC
BACKGROUND: MR imaging can detect nasopharyngeal carcinoma that is hidden from endoscopic view, but for accurate detection carcinoma confined within the nasopharynx (stage T1) must be distinguished from benign hyperplasia of the nasopharynx. This study aimed to document the MR imaging features of stage T1 nasopharyngeal carcinoma and to attempt to identify features distinguishing it from benign hyperplasia.
METHOD: MR images of 189 patients with nasopharyngeal carcinoma confined to the nasopharynx and those of 144 patients with benign hyperplasia were reviewed and compared in this retrospective study. The center, volume, size asymmetry (maximum percentage difference in area between the right and left nasopharyngeal halves), signal intensity asymmetry, deep mucosal white line (greater contrast enhancement along the deep tumor margin), and absence/distortion of the adenoidal septa were evaluated. Differences were assessed with logistic regression and the 2 test.
RESULTS: The nasopharyngeal carcinoma center was lateral, central, or diffuse in 134/189 (70.9%), 25/189 (13.2%), and 30/189 (15.9%) cases, respectively. Nasopharyngeal carcinomas involving the walls showed that a deep mucosal white line was present in 180/183 (98.4%), with a focal loss of this line in 153/180 (85%) cases. Adenoidal septa were absent or distorted in 111/111 (100%) nasopharyngeal carcinomas involving the adenoid. Compared with benign hyperplasia, nasopharyngeal carcinoma had a significantly greater volume, size asymmetry, signal asymmetry, focal loss of the deep mucosal white line, and absence/distortion of the adenoidal septa (P .001). Although size asymmetry was the most accurate criterion (89.5%) for nasopharyngeal carcinoma detection, use of this parameter alone would have missed 11.9% of early-stage T1 nasopharyngeal carcinomas.
CONCLUSIONS: MR imaging features can help distinguish stage T1 nasopharyngeal carcinoma from benign hyperplasia in most cases
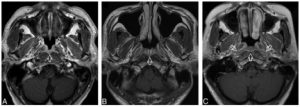
A, Axial T1-weighted postcontrast MR image of the nasopharynx in a 53-year-old man with BH1 (open arrows). An area of diffuse symmetric mucosal thickening with homogeneous contrast enhancement is visible. B, Axial T1-weighted postcontrast MR image of the nasopharynx in a 28-year-old man with BH2 of the adenoid (open arrow). The symmetric lesion exhibits contrast-enhancing septa that run perpendicular to the nasopharyngeal wall and are separated by columns of low contrast enhancement. C, Axial T1-weighted postcontrast MR image of the nasopharynx in a 48-year-old woman with BH2 along the nasopharyngeal walls (open arrows). An area of diffuse, symmetric homogeneous low contrast enhancement and an intact deep mucosal white line along the deep margin are visible.
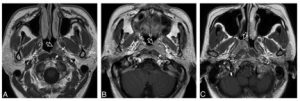
A, Axial T1-weighted postcontrast MR image of the nasopharynx in a 51-year-old man with NPC (open arrow). An asymmetric tumor with a lateral center at the level of the left pharyngeal recess is confined to 1 side of the nasopharynx. The tumor exhibits homogeneous low contrast enhancement with an intact deep mucosal white line (small solid arrows) along the deep margin. B, Axial T1-weighted postcontrast MR image of the nasopharynx in a 68-year-old man with NPC (open arrow). An asymmetric tumor with a lateral center at the level of the left pharyngeal recess is confined to 1 side of the nasopharynx. The tumor exhibits homogeneous moderate contrast enhancement with a focal loss of the deep mucosal white line (small solid arrows) along the deep margin. C, Axial T1-weighted postcontrast MR image of the nasopharynx in a 44-year-old woman with NPC (open arrow). An asymmetric tumor with a lateral center at the level of the right side of the roof shows heterogeneous contrast enhancement.
DCE-MRI FOR PRE-TREATMENT PREDICTION AND POST-TREATMENT ASSESSMENT OF TREATMENT RESPONSE IN SITES OF SQUAMOUS CELL CARCINOMA IN THE HEAD AND NECK
King AD, Chow SKK, Yu KH, Mo FKF, Yeung DKW, Yuan J, Law BKH, Bhatia KS, Vlantis AC, Ahuja AT.
BACKGROUND: It is important to identify patients with head and neck squamous cell carcinoma (SCC) who fail to respond to chemoradiotherapy so that they can undergo post-treatment salvage surgery while the disease is still operable. This study aimed to determine the diagnostic performance of dynamic contrast enhanced (DCE)-MRI using a pharmacokinetic model for pre-treatment predictive imaging, as well as post-treatment diagnosis, of residual SCC at primary and nodal sites in the head and neck.
METHOD: Forty-nine patients with 83 SCC sites (primary and/or nodal) underwent pre-treatment DCEMRI, and 43 patients underwent post-treatment DCE-MRI, of which 33 SCC sites had a residual mass amenable to analysis. Pre-treatment, post-treatment and % change in the mean Ktrans, kep, ve and AUGC were obtained from SCC sites. Logistic regression was used to correlate DCE parameters at each SCC site with treatment response at the same site, based on clinical outcome at that site at a minimum of two years.
RESULTS: None of the pre-treatment DCE-MRI parameters showed significant correlations with SCC site failure (SF) (29/83 sites) or site control (SC) (54/83 sites). Post-treatment residual masses with SF (14/33) had significantly higher kep (p = 0.05), higher AUGC (p = 0.02), and lower % reduction in AUGC (p = 0.02), than residual masses with SC (19/33), with the % change in AUGC remaining significant on multivariate analysis.
CONCLUSION: Pre-treatment DCE-MRI did not predict which SCC sites would fail treatment, but post-treatment DCE-MRI showed potential for identifying residual masses that had failed treatment.
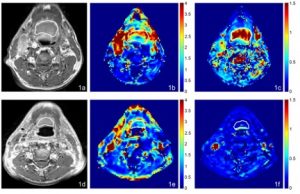
MRI, AUGC and kep maps in the axial plane from a 70 year old male with oropharyngeal carcinoma and SC 46.7 months after chemoradiotherapy. (a) Pre-treatment T1-weighted post contrast image of the SCC, (b) Pre-treatment AUGC map (mean AUGC = 2.36), (c) Pre-treatment kep map (mean kep = 1.62); (d) Post-treatment T1-weighted post contrast image of the SC residual mass, (e) Post-treatment AUGC map (mean AUGC = 0.96), (f) Post-treatment kep map (mean kep = 0.09).
MRI, AUGC and kep maps in the axial plane from an 85 year old male with oral cavity carcinoma with SF 3.6 months after chemoradiotherapy. (a) Pre-treatment T1-weighted post contrast image of the SCC, (b) Pre-treatment AUGC map (mean AUGC = 3.07), (c) Pre-treatment kep map (mean kep = 0.88); (d) Post-treatment T1-weighted post contrast image of the residual mass with SF, (e) Post-treatment AUGC map AUGC (mean AUGC = 3.72), (f) Posttreatment kep map (mean kep = 0.63).
MRI OF DIFFUSE LARGE B-CELL NON-HODGKIN’S LYMPHOMA OF THE HEAD AND NECK: COMPARISON OF WALDEYER’S RING AND SINONASAL LYMPHOMA
King AD, Law BKH, Tang WK, Mo FKF, Raghupathy R, Bhatia KS, Lei KIK.
AIM: To document the magnetic resonance imaging (MRI) features of diffuse large B-cell lymphoma (DLBCL) in Waldeyer’s ring (WR) and the sinonasal (SN) region, and to identify any differences between lymphatic and extra-lymphatic DLBCLs, and predictors of disease beyond the neck.
MATERIALS AND METHODS: Primary, nodal, and multifocal sites on head and neck MRI were compared between 31 WR and 15 SN DLBCL, and between 27 patients with disease confined to the head and neck and 16 patients with disease beyond the neck, using logistic regression.
RESULTS: Compared to SN, WR DLBCLs had significantly smaller primary tumour volumes (p = 0.009), less deep invasion (p = 0.001), and more nodal disease (p = 0.016). Tumour site (WR vs. SN) was an independent predictor of deep invasion (p = 0.007). Nodal and multifocal diseases were predictors of disease beyond the neck (p = 0.027 and 0.011, respectively).
CONCLUSIONS: Lymphatic WR DLBCLs were less locally aggressive but had greater propensity to nodal spread than extra-lymphatic SN DLBCLs. Nodal and multifocal diseases predicted disease beyond the neck.
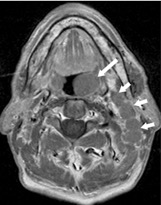
A 74-year-old male with Waldeyer’s ring DLBCL. Axial T1- weighted image post-contrast showing an exophytic tumour in the left palatine tonsil (long arrow) without deep invasion, and left upper internal jugular nodes (short arrows)
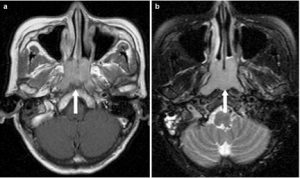
A 63-year-old female with Waldeyer’s ring DLBCL. a Axial T1-weighted image post-contrast and b T2-weighted image with fat saturation showing an exophytic tumour in the nasopharynx (long arrow) with contiguous superficial spread to the nasal cavity but without any deep invasion
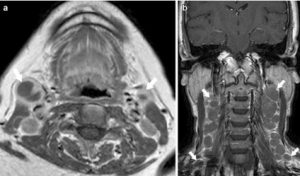
A 68-year-old female with Waldeyer’s ring DLBCL. Axial T1-weighted image post-contrast showing necrotic right and left upper internal jugular nodes (short arrows). b A 50-year-old female with Waldeyer’s ring DLBCL. Coronal T1-weighted image postcontrast showing bilateral nodes with orderly spread down the neck (short arrows)
DIFFUSION-WEIGHTED IMAGING OF NASOPHARYNGEAL CARCINOMA: CAN PRETREATMENT DWI PREDICT LOCAL FAILURE BASED ON LONG-TERM OUTCOME?
Law BKH, King AD, Bhatia KS, Ahuja AT, Kam MKM, Ma BB, Ai QY, Mo FKF, Yuan J, Yeung DKW
BACKGROUND: Pretreatment prediction of patients with nasopharyngeal carcinoma who will fail conventional treatment would potentially allow these patients to undergo more intensive treatment or closer posttreatment monitoring. The aim of the study was to determine the ability of pretreatment DWI to predict local failure in patients with nasopharyngeal carcinoma based on long-term clinical outcome.
MATERIALS AND METHODS: One hundred fifty-eight patients with pretreatment DWI underwent analysis of the primary tumor to obtain the ADC mean, ADC skewness, ADC kurtosis, volume, and T-stage. Univariate and multivariate analyses using logistic regression were performed to compare the ADC parameters, volume, T-stage, and patient age in primary tumors with local failure and those with local control, by using a minimum of 5-year follow-up to confirm local control.
RESULTS: Local control was achieved in 131/158 (83%) patients (range, 60.3–117.7 months) and local failure occurred in 27/158 (17%) patients (range, 5.2–79.8 months). Compared with tumors with local control, those with local failure showed a significantly lower ADC skewness (ADC values with the greatest frequencies were shifted away from the lower ADC range) (P .006) and lower ADC kurtosis (curve peak broader) (P .024). The ADC skewness remained significant on multivariate analysis (P .044). There was a trend toward higher tumor volumes in local failure, but the volume, together with T-stage and ADC mean, were not significantly different between the 2 groups.
CONCLUSIONS: Pretreatment DWI of primary tumors found that the skewness of the ADC distribution curve was a predictor of local failure in patients with nasopharyngeal carcinoma, based on long-term clinical outcome.
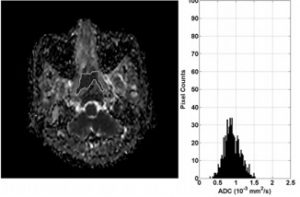
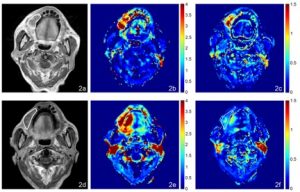
ADC map and histogram of primary NPC before treatment in a 50-year-old woman with local failure. The histogram shows that the greatest frequency of ADC values is shifted toward the central ADC range (ADC skewness 0.11) and the peak is broadened (ADC kurtosis 3.89).
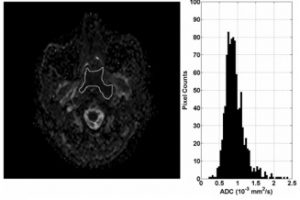
ADC map and histogram of primary NPC before treatment in a 43-year-old man with local control. The histogram shows that the greatest frequency of ADC values is shifted toward the lower ADC range (ADC skewness 1.42) and the peak is more acute (ADC kurtosis 8.77)
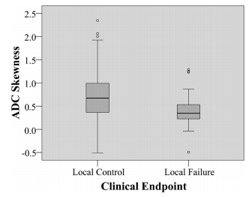
Side-by-side boxplots of ADC skewness comparing local control and local failure.